
Blog |
Discussing current issues in engineering
|
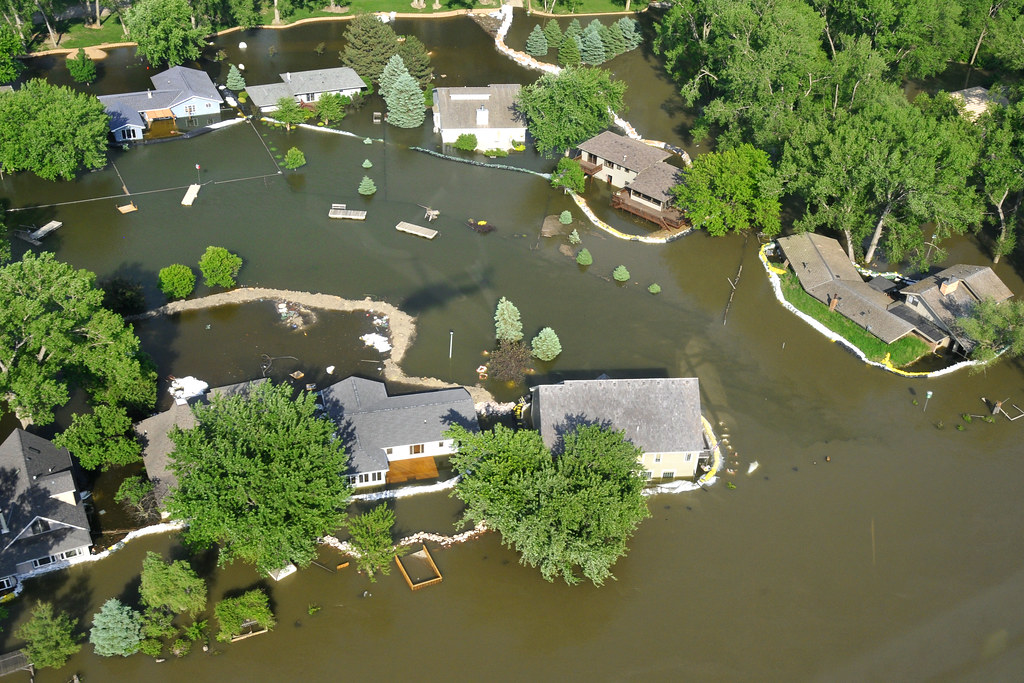 Photo credit: TSGT Oscar M. Sanchez, CC BY-ND 2.0 Homeowners and renters alike may be familiar with the Federal Emergency Management Administration (FEMA)’s Flood Maps, which provide a visual representation of a community’s flood risk. The National Flood Insurance Program (NFIP), which is managed by FEMA, uses community flood risks gathered from FEMA maps to calculate insurance rates for its more than 5.1 million policyholders—policyholders who, by many accounts, used FEMA flood maps to calculate their potential risk and therefore inform policy-buying decisions in the first place.
Unfortunately, FEMA maps were created to represent risks at a community level, and consequently do not serve as an accurate measure of risk for individual properties. The flood risk research nonprofit First Street Foundation uses modeling techniques to fill in these informational gaps, thereby establishing the first public collection of property-level flood risk data in the United States. In a 2020 report, First Street Foundation’s team of researchers found that 14.6 million properties across America were characterized by substantial flood risk (a one-percent chance of annual flooding). Millions of these property owners may have been previously unaware of their risk because their properties were located outside of FEMA’s Special Flood Hazard Areas and were therefore excluded from FEMA Flood Maps. In a study published last month, First Street Foundation noted that some property owners took steps to mitigate potential flood damage in 2020, thereby decreasing the number of residential properties at risk of unmitigated flood-related financial loss to 4.3 million. This decrease shows marked improvement for many properties once at unabated risk. Nonetheless, the February report makes it clear that underestimated flood risk remains a significant financial threat to millions of American households. The discrepancy between supposed flood risk and actual flood risk is evidenced by substantial difference between premium flood insurance rates and estimated financial costs to properties as a result of flooding events. The average NFIP premium for the 5.7 million American properties with any flood risk is $902, while the average estimated loss for these same properties is $3,343 per year. This means that the current economic risk to 5.7 million properties is 3.7 times higher than the NFIP’s insurance pricing. The disparity continues to grow as sampled data is limited to the 4.3 million properties with substantial flood risk, where the average estimated annual loss of $4,419 is 4.5 times greater than the NFIP’s premium of $981. The First Street Foundation’s February report highlights the need for increased flood risk awareness among American property owners and increased flood insurance coverage among insurers. As flood events become more widespread and intense due to climate change, America’s number of at-risk properties will continue to rise. Visit FloodFactor.com to access current flood risk data for 142 million public and private properties. Click here to read the First Street Foundation’s February 2021 report. Every four years, the American Society of Civil Engineers (ASCE) releases its assessment of the current condition and needs of United States infrastructure. The Report Card for America’s Infrastructure takes the form of a school report card, with grades designated from A to F, as an easily identifiable (and modestly tongue-in-cheek) depiction of where our nation’s infrastructure stands in relation to our public safety, health, economic, and security goals.
This year, America ranked just below average at a C- overall. This is up from a D+ in 2017 and marks the first time that American infrastructure has ranked above the D range in two decades, indicating incremental progress in infrastructure restoration. According to Ruwanka Purasinghe, EIT, A.M.ASCE, a member of the committee that determines the quadrennial grade, “the overall grade of a C- shows that we’re on the right track but have a ways to go.” The Infrastructure Report Card overall grade is derived from the assessment of seventeen individual categories—aviation, drinking water, energy, public parks, schools, stormwater, and transit, to name a few. Like nearly every other aspect of American societal life, all seventeen categories have faced heightened strain throughout the pandemic as COVID-19 continues to impact revenue streams intended for infrastructure. At the same time, climate change tests the limits of our existing structures and related severe weather events impede potential restoration efforts. Now more than ever, infrastructure networks require attention and investment in order to overcome the obstacles before them. The ASCE cites three significant trends that contribute to report results for all assessed sectors. Firstly, the society highlights maintenance backlogs, a persistent issue also featured in the 2017 Report Card, as a cause of poor system performance. Nonetheless, the ASCE notes that new technology and appropriate asset management are helping to bridge the gap between limited funds and necessary maintenance. Secondly, in the last four years, federal, state, and local governments have made positive impacts on sectors through financial and human investment. For example, more than 25 major cities and states have now appointed chief resilience officers in order to promote resilience building at the state and local level. Lastly, the ASCE notes that some infrastructure sectors suffer from a scarcity of condition information and reliable data. When it comes to stormwater, for example, a dearth of updated asset records prevents accurate estimations for the lifespans of stormwater conveyance systems across the country. When the ASCE unveiled the 2021 report at a virtual news conference last week, representatives from all corners of industry and politics voiced the need for bipartisan support on infrastructure investment. With a mounting annual investment gap of nearly $260 billion, America’s infrastructure can wait no longer. Infrastructure shortcomings demand resolutions—our collective economic foundation and quality of life depend on it. To read the ASCE’s 2021 Report Card for America’s Infrastructure, click here. |
Colman Engineering, PLCA professional engineering firm located in Harrisonburg, VA Archives
January 2022
|

 RSS Feed
